Platform
Twelve capabilities. Each one is a task a person on a rota does today.
Grouped by what they take off a person's desk, and therefore by where the operating cost comes out.
- ObserveContinuous visibility across servers, networks, applications, endpoints and security tooling. No shift handover, no blind window.
- CorrelateA storm of related alerts collapses into one root-cause incident, not dozens of tickets.
- ResolveRuns the remediation an L1/L2 engineer would: restart a service, reclaim disk, isolate a host, block an indicator.
- EscalateThe genuinely complex case reaches a person with timeline, evidence and recommended action assembled.
Capability map
What Orion AI takes off the rota.
Detect & decide
- AI-based monitoring
Predictive, anomaly-detecting telemetry across every node in the estate. - Intelligent alert generation
Separates true signal from network noise before anything is raised. - Alert policing
Aggressive de-duplication and correlation: one incident, not forty tickets.
Act & resolve
- Auto-incident creation
Tickets raised, classified, enriched and routed into your ITSM without a keystroke. - Autonomous rectification
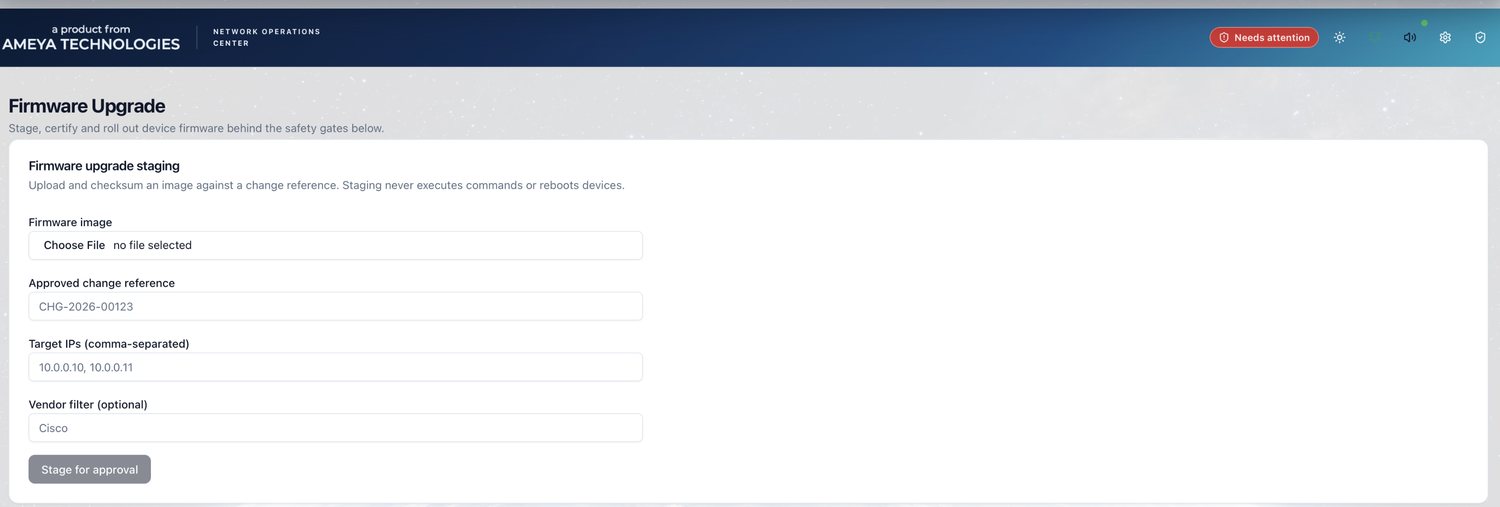
AI-driven troubleshooting and self-healing against permissioned runbooks. - Bulk image upgrades
Safety-gated, scheduled firmware and software rollouts across the fleet.
Know the estate
- Advanced asset management
Automated CI discovery with dynamic department and location tagging. - Integrated CMDB / CI
Real-time, auto-updating relationship mapping, so the CMDB stops going stale. - Configuration backup
Continuous, version-controlled state preservation with one-click restore.
Govern & prove
- AI suggestions on SR / CR
Predictive insight and risk scoring on every service and change request. - Automated reporting & audit
Compliance-ready, granular reporting generated on schedule. - Centralised AI governance
Full transparency and control over what the AI may decide and do.
Inside the console
The tool, as operators see it.
Screenshots from a running Orion AI environment, using lab data.
Orion AI NOC
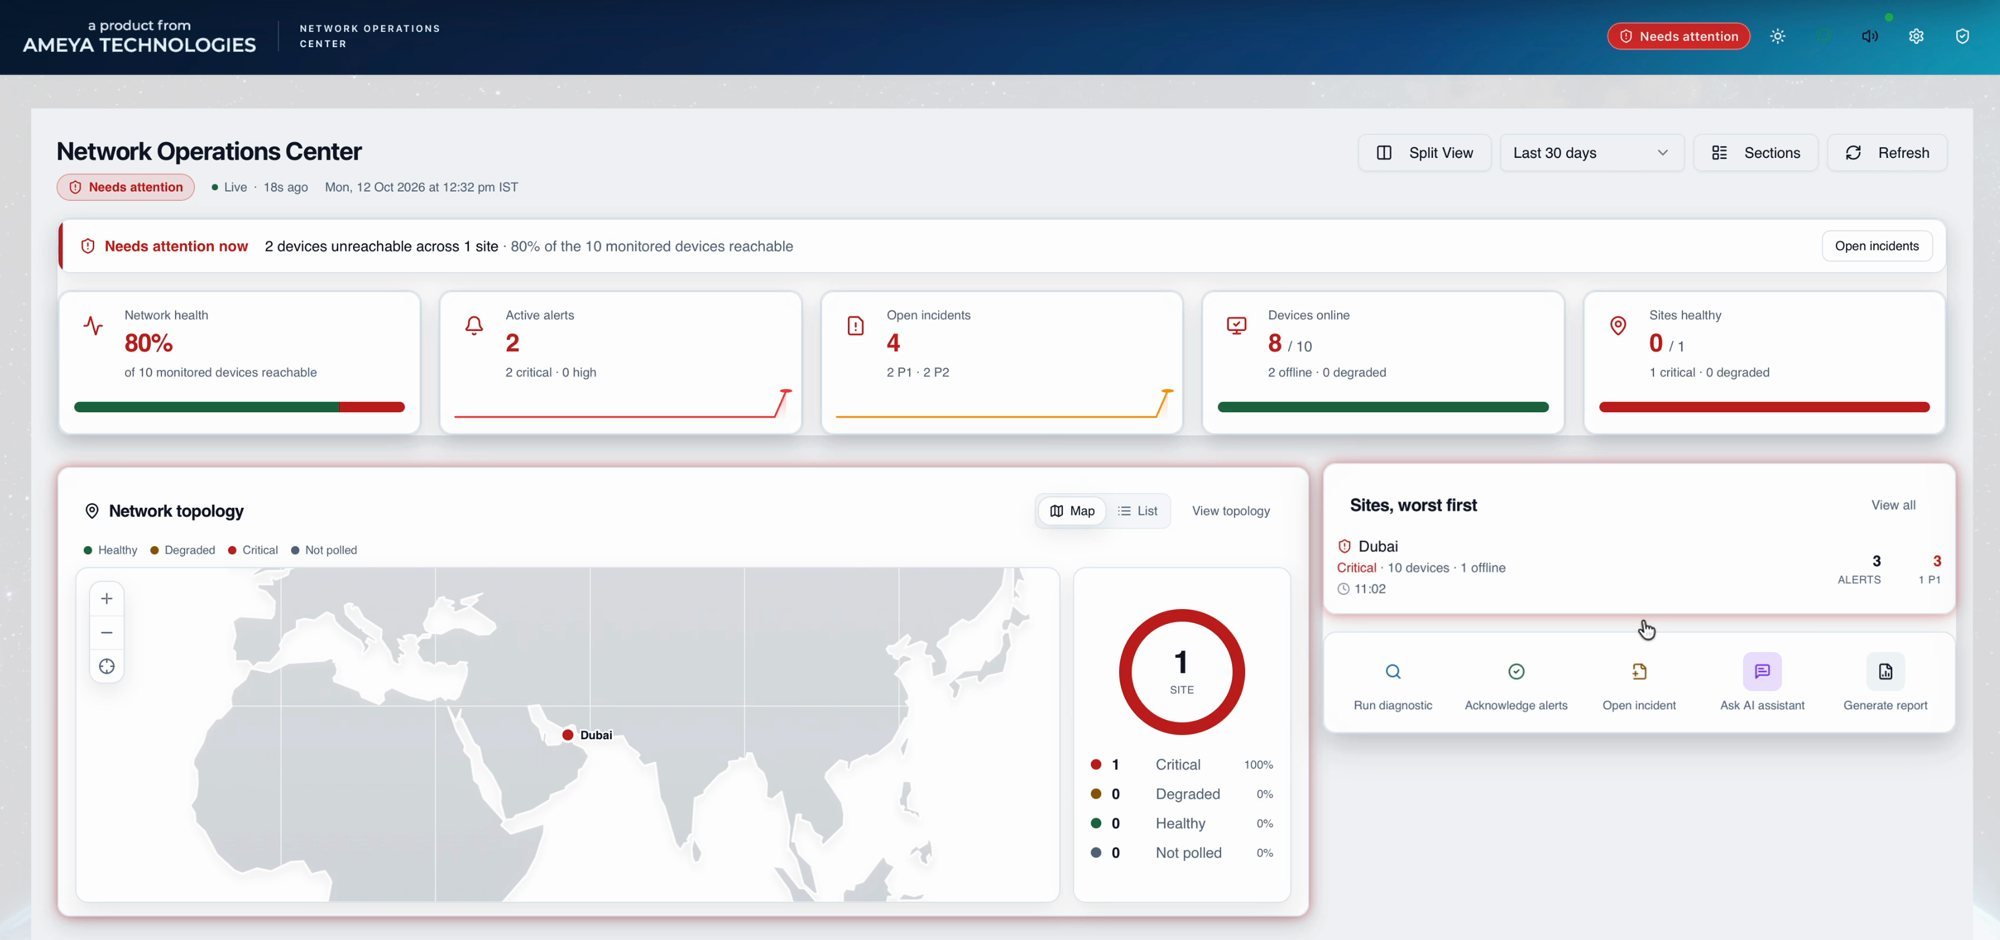
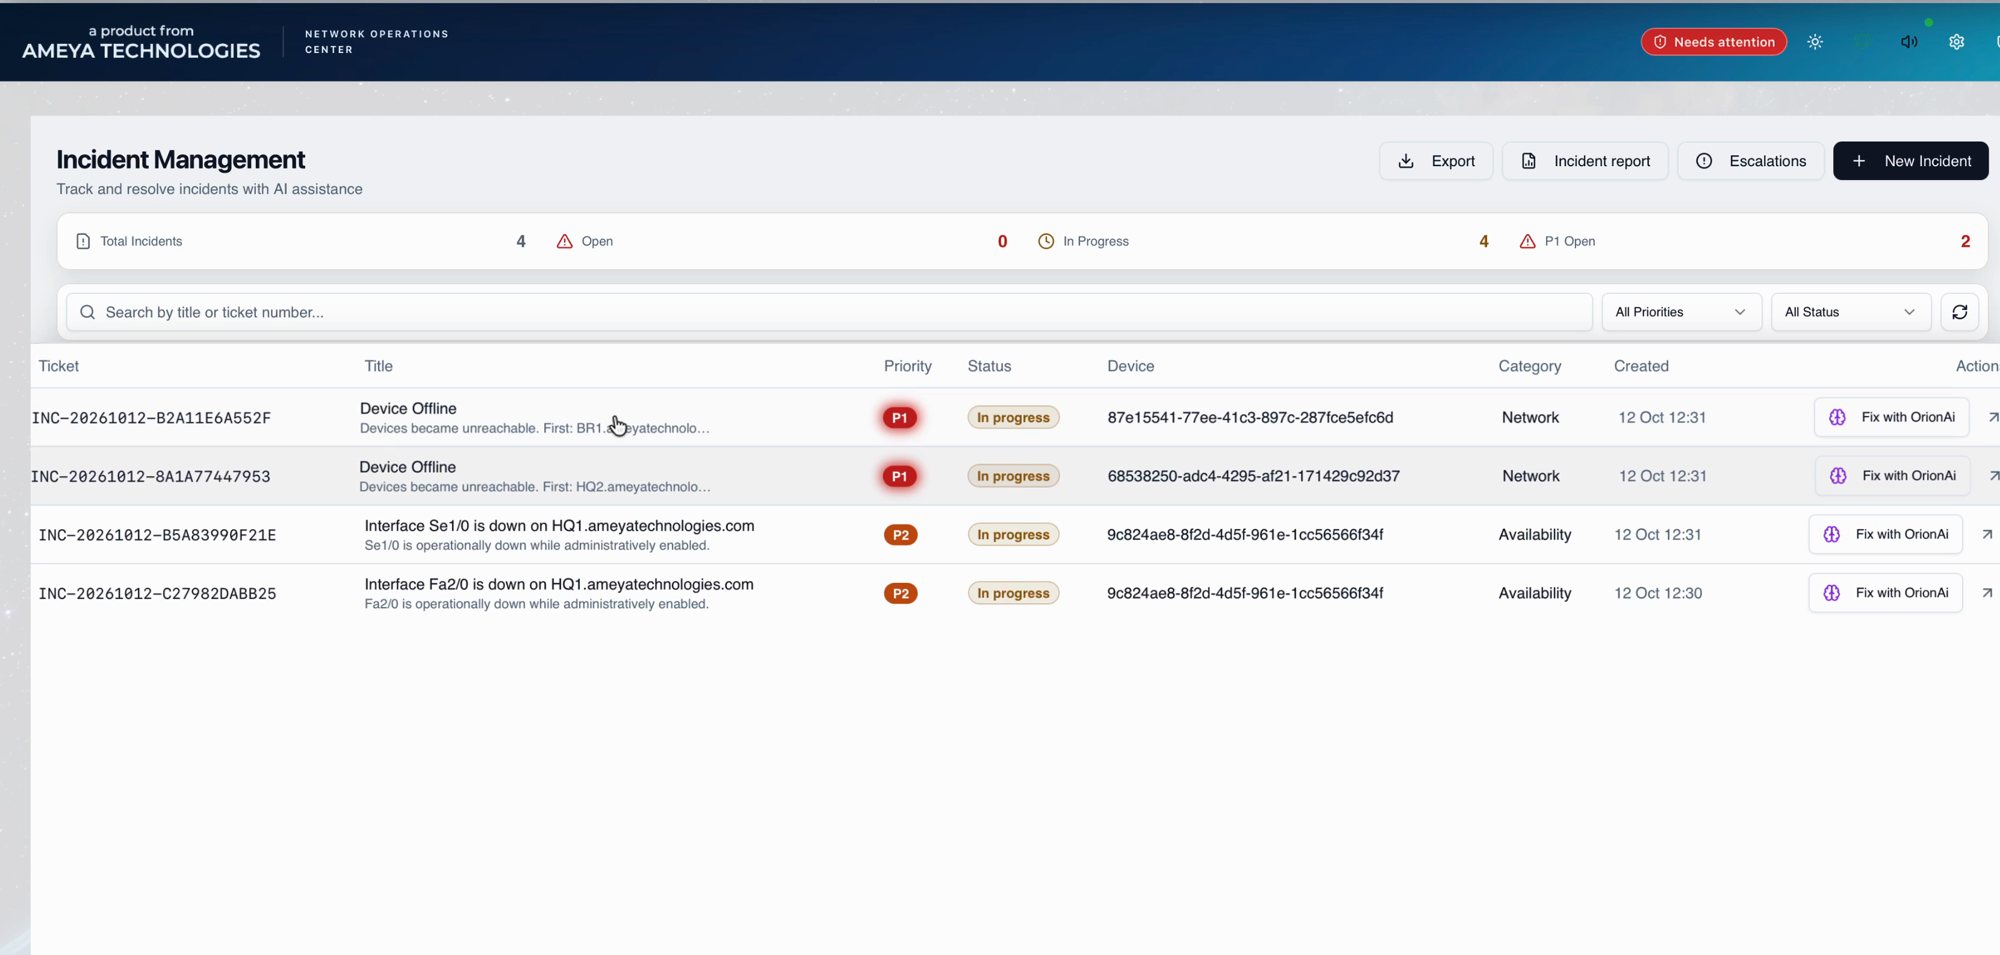
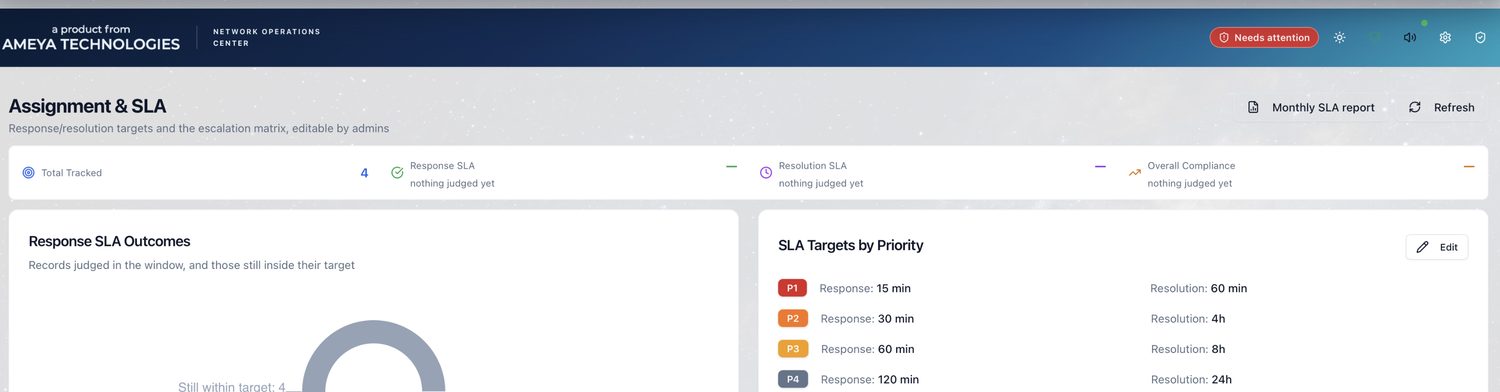
The network operations centre, run as a closed loop.
Continuous watch over network, compute and storage, applications and services, and cloud and hybrid estate, in one pane. Failure modes with a known fix are resolved; ones that announce themselves are prevented.
- Network: routers, switches, firewalls, SD-WAN, links and circuits
- Compute & storage: physical, virtual and containerised workloads
- Applications: availability, latency, error rates, dependency health
- Cloud & hybrid: public cloud alongside on-premise
400 alerts collapsed to one incident; the degrading optic is identified and traffic rerouted before the SLA clock starts.
Predicted days ahead from the trend, reclaimed automatically, ticket closed with the evidence attached.
Restarted against your own runbook, verified healthy, and escalated only if the second attempt fails.
Detected against the last known-good version, reported, and restored on approval.
Orion AI SOC
The same engine, pointed at the security queue.
Between 46% and 83% of security alerts are false positives and only 10 to 30% need human judgement, yet an analyst reads all of them. The SOC module triages, enriches, scores and contains, and escalates only what has earned a person's attention.
Triage
Every alert classified against context, asset criticality and prior disposition. The false positive is closed, not queued.
Enrich
Threat intelligence, identity, asset ownership and history attached before a human looks.
Score
Risk-ranked against the estate, so the queue is ordered by consequence.
Contain
Permissioned playbooks isolate a host, disable a session or block an indicator within seconds.
Investigate
The complex case reaches the analyst as a written timeline with evidence and a recommended next action.
Source: published SOC alert research (2026).
No rip-and-replace
Sits on top of the estate you already paid for.
There is no migration to fund. Orion AI reads the tools already in place and acts through the systems already trusted. Connector build-out for non-standard sources is covered by the one-time deployment fee.
Sources in
- SNMP, syslog, NetFlow, streaming telemetry
- Zabbix, SolarWinds, PRTG, Nagios, LogicMonitor
- AWS, Azure, GCP, OCI monitoring
- Prometheus, Grafana, Elastic, Datadog
- SIEM, EDR, firewall, identity and threat feeds
Systems of record
- ServiceNow, Jira Service Management, Freshservice, BMC
- CMDB, bi-directional, reconciled by discovery
- Change and approval workflows
- Asset and licence registers
- Reporting and BI targets
Actions out
- Device and infrastructure commands
- Ansible, Terraform, native cloud APIs
- Container and platform control planes
- Email, Teams, Slack, SMS, voice
- Your own runbooks and scripts, under permission
Measure it in your numbers
Start with a 60 to 90 day pilot.
Prove ticket deflection and cost per seat on your own queue, then decide how far to take it.